Predicting the future is hard, if not impossible. Yet, users expect it constantly.
Whether they are waiting for a package delivery, their turn on a rollercoaster, or their food order at a busy restaurant, they want to know when. We all have better things to do than to wait.
So I decided to build one. And along the way, I learned why it is so damn hard.
The setup: a chaotic queue
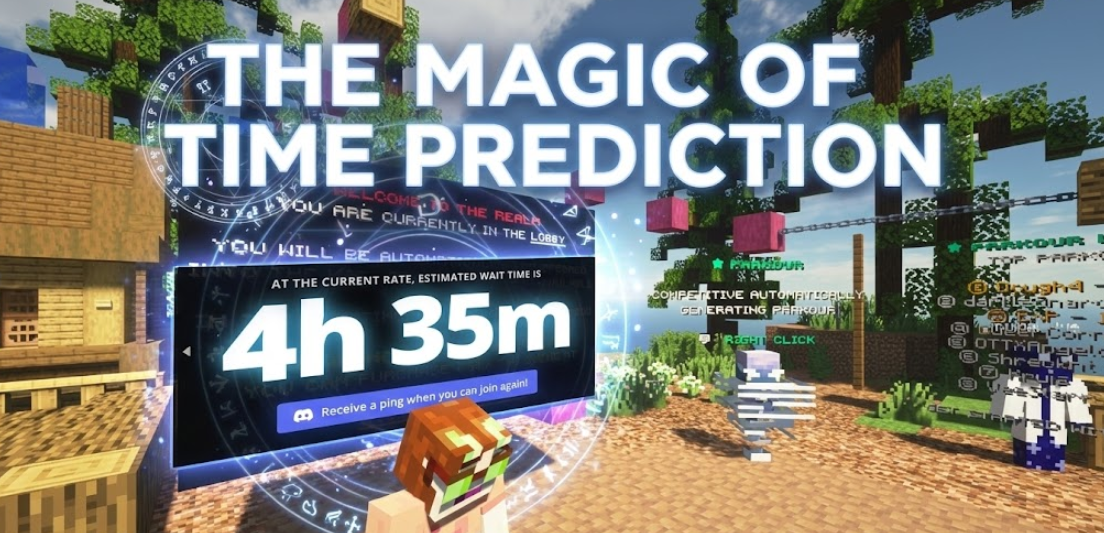
Tubbo (a popular Minecraft streamer) recently launched his own server called realmSMP. With millions of followers, the launch attracted way more players than any server could handle.
When I tried to join, I was greeted with a queue system with hundreds of players waiting their turn, each with nothing but a number: your current spot in line and the total queue size.
That is it. No estimated wait time. No progress bar. Just raw numbers.
And that is when I went: "Surely, with just those two numbers over time, I can predict how long this will take?"
Why the obvious solution does not work
At first glance, queue prediction seems trivial. Just measure how fast people are leaving, and divide your position by that speed:
If you are at position 100 and people leave at 5 per minute, you will wait 20 minutes. Easy, right?
This works great when the queue moves at a constant speed, like a theme park ride where guests board every 2 minutes like clockwork.
But the realmSMP queue had a problem: chaos.
The chaos factors
Two things make this queue unpredictable:
1. Priority players can cut the line Some players paid for priority access, which means they skip ahead. When that happens, your position can actually increase. You are 50th in line, then suddenly 53rd, even though you did not move.
2. There is no forced session limit Unlike theme parks where rides have fixed durations, Minecraft players can stay as long as they want. If a content creator is streaming, players stick around for hours. If it is dinnertime in Europe, suddenly half the server logs off at once.
The solution: be pessimistic
After a lot of trial and error, I settled on what I call the pessimist's approach.
Instead of trying to predict the "correct" speed, I calculate multiple speed estimates and always use the slowest one.
| Speed Type | What it measures |
|---|---|
| Recent speed | How fast the queue moved in the last 5 minutes |
| Session speed | Your average since joining the queue |
| Historical speed | Average from previous complete runs |
Then I pick whichever gives the longest estimate.
Why? Because under-promising beats over-promising. If I say "20 minutes" and you get in after 15, you are pleasantly surprised. If I say "10 minutes" and it takes 25, you are frustrated.
See how the algorithm picks between different speed measurements:
Queue Speed Selector
The Queue:(front)← You (#0)Waiting to start...Historical45s/spotFrom past runsSessionCalculating...Since you joinedRecentNeed more data...Last 5 minutesUsing: historical speed (the slowest)The algorithm always picks the slowest speed for a reliable estimateYour ETA0s
Finding the trend, not just the average
Here is where it gets interesting. A simple average tells you "the queue moved at 3 spots per minute", but it cannot tell you if things are speeding up or slowing down.
That matters! If the queue is accelerating (people leaving faster and faster), you will probably get in sooner. If it is decelerating, brace yourself for a longer wait.
To detect trends, we use something called linear regression, which basically finds the best straight line through a bunch of messy data points.
The demo below tries to visualize this, by showing the anticipated time (green line) powered by linear regression, which turns out to be a pretty solid prediction of where the average line would end up.
Live Regression
Green = trend (direction of change). Red = average (middle value). The trend helps predict if things will improve or worsen!
Real data: what does chaos look like?
Here is what actual queue data from realmSMP looked like over a typical day:

You can see the patterns: periods of steady movement, sudden jumps when priority players cut in, and moments where everything stalls completely.
The velocity graph is even more telling:
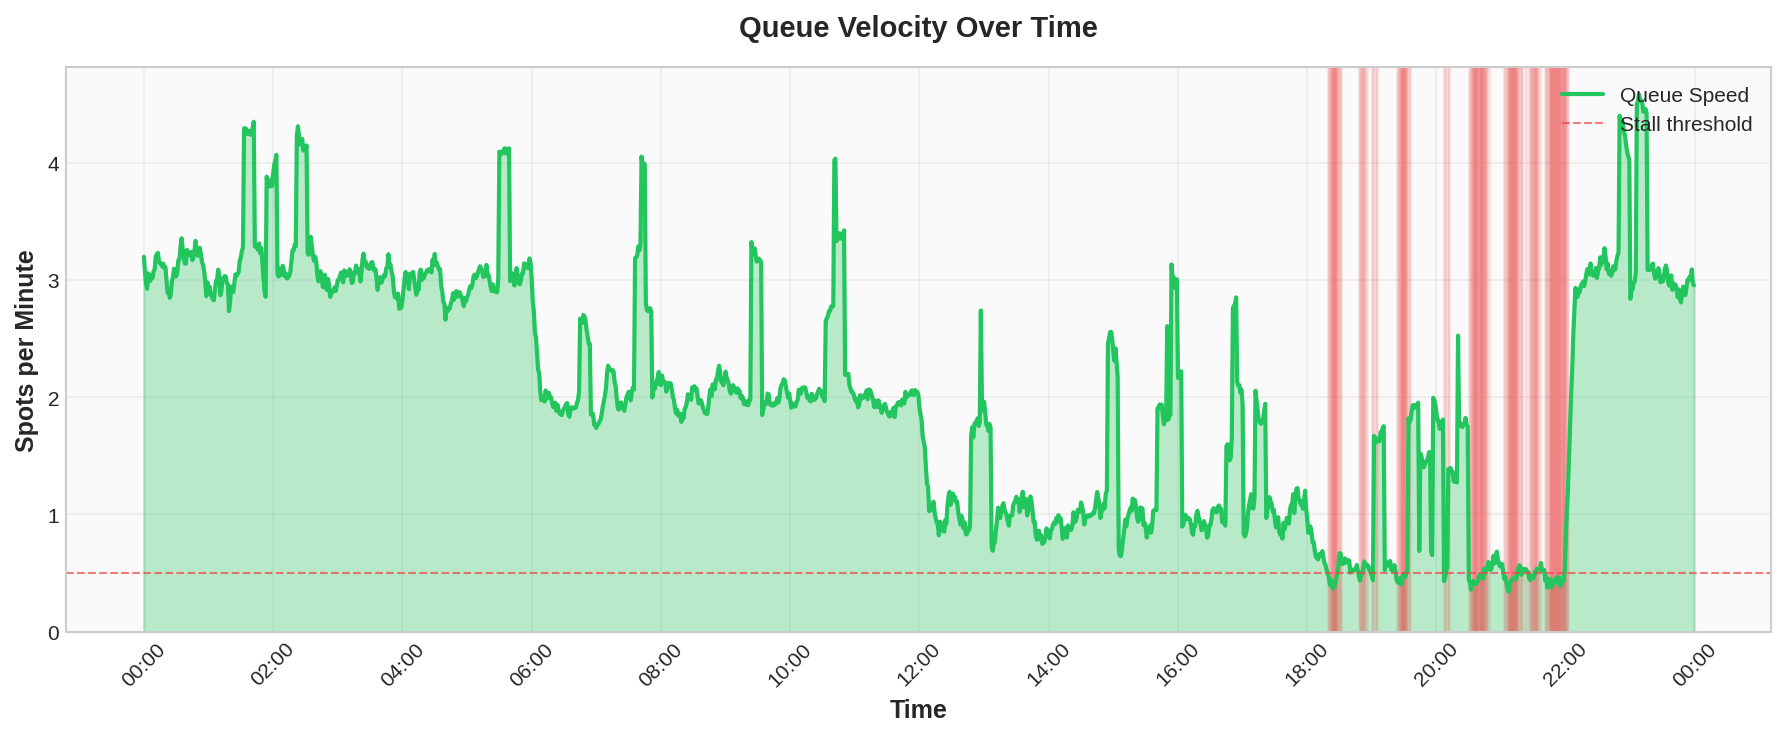
Those spikes? Moments when a bunch of players suddenly logged off (probably dinner in Europe). The flat sections are harder to explain. This could show priority players overwhelming the queue, or a "stable" period where the queue growth is equal to the throughput.
The feedback loop
The beautiful part of this system is that it learns from itself.
Every time we complete a full queue run (joining to reaching the front), we record exactly how long it took. That becomes "historical data" that helps future predictions.
Early estimates are rough guesses. But after a few full runs through the queue, the system has real data about how this queue actually behaves, and the predictions get remarkably accurate.
What I learned
Building this taught me a few things about prediction in general:
-
Users prefer pessimistic estimates. A comfortable overestimate beats a stressful underestimate, every time.
-
Trends matter more than averages. Knowing if things are getting better or worse is more useful than knowing the current speed.
-
Real-world data is messy. Textbook examples use clean data. Reality has priority players, dinner time, and streamers.
-
Self-improving systems are powerful. Feeding real outcomes back into the model makes predictions better over time, without any fancy machine learning.
The fundamental insight is that queue prediction is not about being right. It is about being useful. A prediction that is consistently slightly pessimistic is more valuable than one that oscillates wildly.
Theme parks do this too
If you have ever wondered how theme parks calculate wait times, it is the same principle with different inputs.
Disney asks guests to carry tracking cards through the queue. They measure actual wait times and update the signs accordingly. Some parks use weight sensors on queue barriers, or cameras counting people.
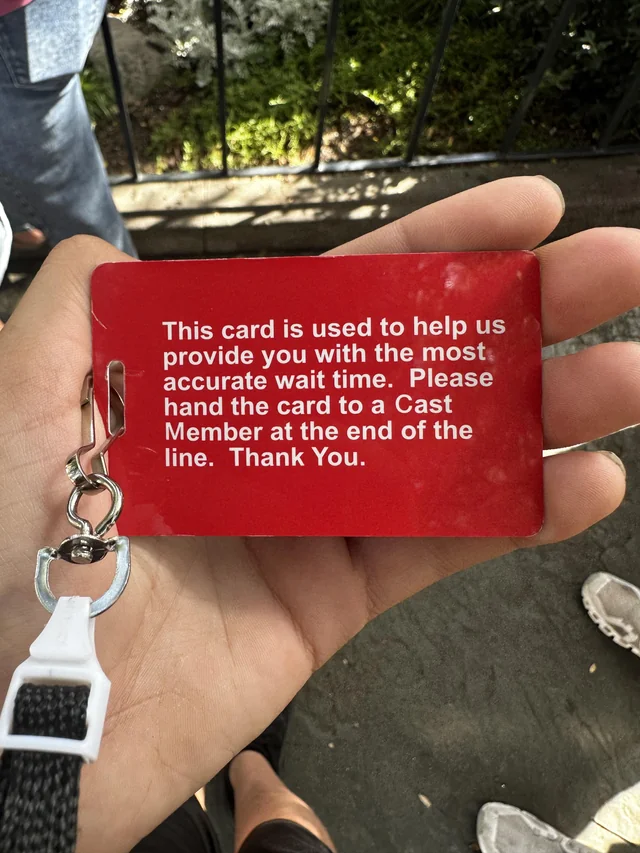
The key insight: they are not predicting the future. They are measuring the recent past and assuming it continues.
That is really all we can do. The future is unknowable. The best we can offer is an educated guess based on what just happened, and enough padding to make sure we do not disappoint.
The result: when-can-i-join-the-realmsmp.net
All of this math and logic culminated in a public tool: when-can-i-join-the-realmsmp.net.
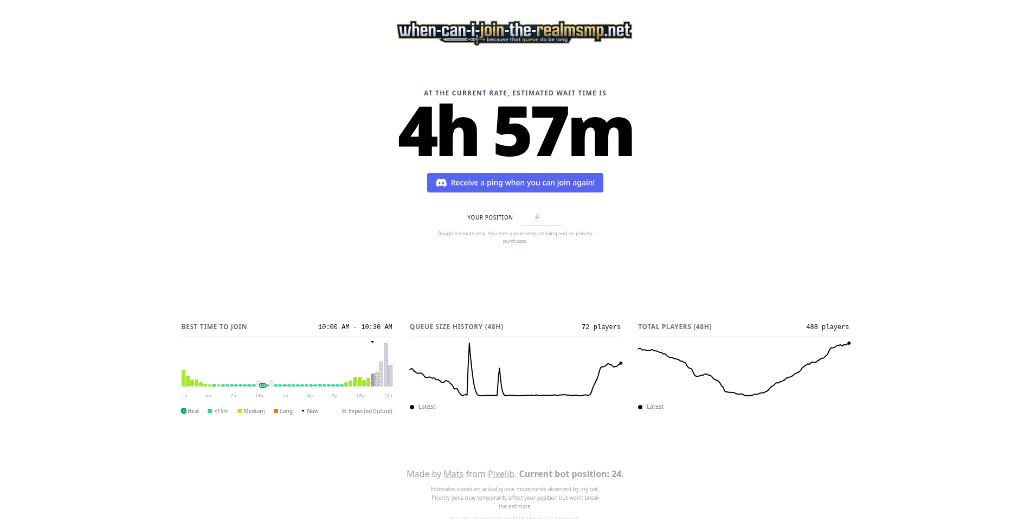
It is a free website where players can see real-time estimates and historical data to find the best time to join. Since its release, it has been used by over 2,000 players to plan their sessions.
It even got a shoutout from Tubbo himself on stream!
If you are stuck in a queue right now, give it a try. At least you will know exactly how long you have to wait.