On 14 August 2023 I pushed a commit called "Efteling lolol".
It added one small command to a server that had nothing to do with theme parks. Every two minutes it asked for the posted wait time of every attraction in the Efteling and wrote the answer to a database. I had no plan for it. I spend a worrying amount of my time building theme parks in a block game, so collecting data about a real one felt like research.
Then I mostly forgot about it for three years.
This article is what came out when I finally looked. It is about 2.3 million data points, 1,144 days, and one question: when should you go, and what should you do once you are inside?
Everything below is based on posted wait times, which is what the park shows in its app. I have no inside information, and I am not affiliated with the Efteling in any way. I just like queues more than is healthy.
The data#
The collector is embarrassingly simple. It takes the posted wait of every ride and writes one row to InfluxDB. It did not get a server of its own. I delegated it to a calm production server of one of my other projects, because it'll be fine (tm).
It was mostly fine. My own collector covers 816 days. For the days it missed, most of them between April 2024 and March 2025, I filled in the daily averages from an external source. On days we both have, its average per ride and mine are about a minute and a half apart, so the two mix well. Those filled-in days only have one number per ride per day, so everything hour-by-hour further down uses my own readings.
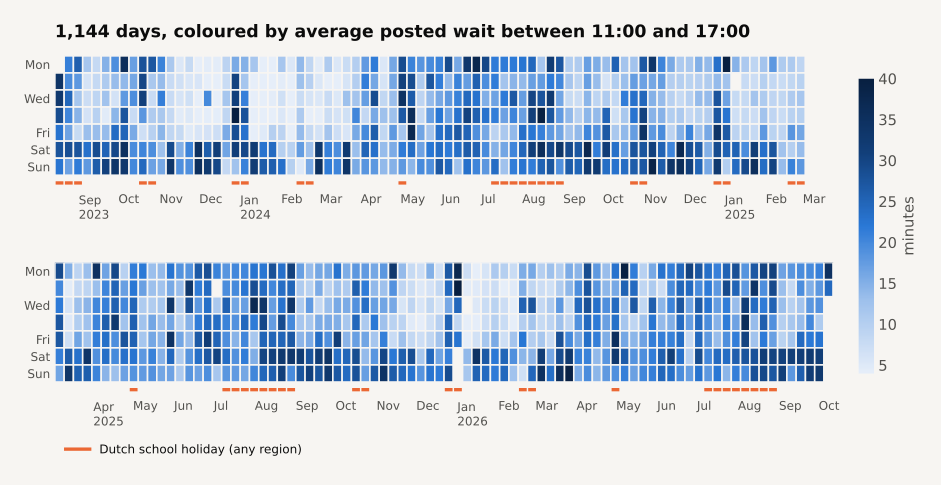
To compare days I use one number: the average posted wait between 11:00 and 17:00, across the nineteen rides that have a real queue. The median day comes out at 18 minutes. The quietest day I have is Thursday 8 February 2024, with an average of under 2 minutes. The busiest is Thursday 28 December 2023, at 44.
One warning before we continue. A posted wait is not a headcount. The steam train says "25 minutes" in 58% of all readings, because that is its timetable and not its queue, so I left it out. And as we will see, the same number of visitors can produce very different waits.
The weekend is the busy season#
The usual advice is to avoid the summer holiday. The data disagrees, or at least it thinks that advice is aimed at the wrong thing.
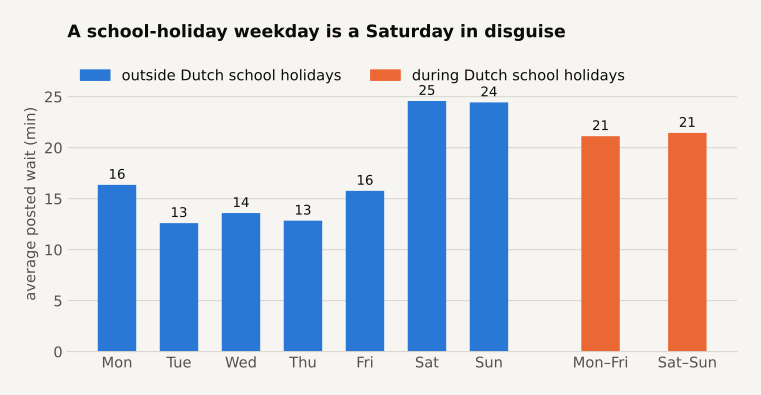
Outside school holidays, a Tuesday or Thursday averages 13 minutes. A Saturday averages 25. That is the single biggest effect in the whole dataset: the day of the week matters more than the month.
During school holidays the weekdays catch up and land at 21 minutes. But look at the last bar. A holiday weekend is not worse than a holiday weekday, and it is slightly quieter than an ordinary Saturday. Once everybody is free on a Wednesday, the weekend loses its monopoly.
It gets more interesting when you split it by month.
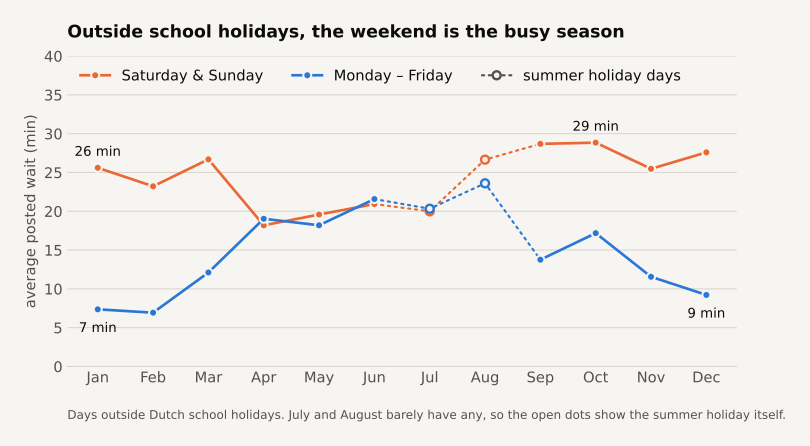
A weekday in January averages 7 minutes. A weekend day in that same January averages 26, which is what an August day looks like. September and October weekends are the worst of the year at 29 minutes.
So the off-season exists, but only from Monday to Friday. Of all ordinary Tuesdays and Thursdays, 68% stay under a 15-minute average. For Saturdays and Sundays that is 12%.
Why are winter weekends so bad when there are fewer people? This is where a few leaked numbers help. Looopings has caught the park's internal attendance forecast on a staff screen more than once. That gives me fifteen days where I know both the expected visitors and my own number. Roughly, every 1,000 visitors add a minute to the average wait.
Roughly. On Monday 10 November 2025 the park expected 14,000 people, and my average was 33 minutes. On 10 June 2025 there were about 22,000, and my average was also 33 minutes. And on four July days with 20,000 to 21,000 expected, it sat around 20.
Same queue, 8,000 fewer people. In November the park closes at 18:00, Baron 1898 was shut for refurbishment, and it was the first day of the Winter Efteling. In July the park is open until 22:00 and everything runs at full capacity. A queue measures people divided by capacity, and in the off-season both shrink.
The other surprise in that chart is spring. From April to June the weekday line climbs until it meets the weekend line at about 20 minutes. I can't prove the cause from wait times alone. My guess is a mix of school trips and the next section.
Check your neighbours' calendars#
The Efteling is half an hour from Belgium and a little over an hour from Germany, so I added school holidays for the three Dutch regions, Flanders, French-speaking Belgium, North Rhine-Westphalia, England and the United States.
On ordinary Dutch weekdays the average wait is 13 minutes. When only Flanders has a holiday it is 21, and when only North Rhine-Westphalia has one it is 17. After correcting for weekday, month and weather, Flemish holidays add about 44%. The German effect shrinks to about 9%, which is on the edge of what I can measure.
The other three do nothing. The park reported a 47% rise in English visitors for 2025, but English term dates leave no mark on the queues.
A few specific days stand out as well:
- The week between Christmas and New Year is the worst of the year. My three busiest days are 28 December 2023, 30 December 2025 and 30 December 2024.
- The Wednesday before Ascension Day was busy in all three years, between 42% and 77% above an average day.
- The rest of the long weekends are a lottery. Ascension Day itself was twice as busy as average in 2024 and half as busy in 2026. The Tuesday after Pentecost was 60% and 80% above average in 2024 and 2025, and 40% below in 2026.
- Easter Sunday was below average in all three years.
- Belgian public holidays count too. The fifth busiest day in the set is Thursday 15 August 2024. That is Assumption Day, a public holiday in Belgium, in the middle of the Dutch summer holiday.
One pattern I did not go looking for. Wednesday 10 April 2024, Monday 31 March 2025 and Friday 20 March 2026 were all 60% to 90% busier than an average day. The last two had no school holiday anywhere near them. The first fell in the Flemish Easter holiday, but was twice as busy as the Tuesday before and the Thursday after. All three were Eid al-Fitr. Three for three is still only three, so I'll call it a strong hunch.
And Monday 5 October 2026, two days ago, was one of the thirty busiest days in the set. I have no idea why.
Rain is your friend, and so is a heatwave#
For weather I used hourly measurements from the KNMI station at Gilze-Rijen, 15 kilometres from the park.
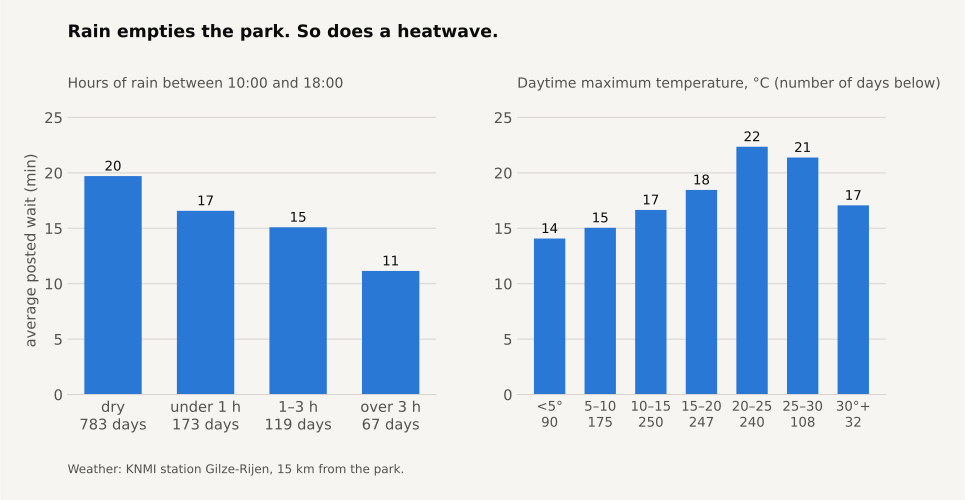
A dry day averages 20 minutes. A day with more than three hours of rain averages 11. In the model, every hour of rain between 10:00 and 18:00 takes about 8% off the queues, on top of everything else.
Temperature has a sweet spot. Queues rise with the thermometer up to about 25 degrees and then fall again, by roughly 8% for every degree above that. On 26 June 2026 the KNMI issued a code red for heat and Gilze-Rijen measured 38 degrees. The park stayed open, closed a number of outdoor rides, and shut two hours early the day after. My average for that Friday: 8 minutes.
I am not telling you to visit during a code red. But a forecast of 30 degrees or a grey drizzle is worth more than any amount of planning.
Rain also moves people around inside the park, and you can see it happen within the hour.
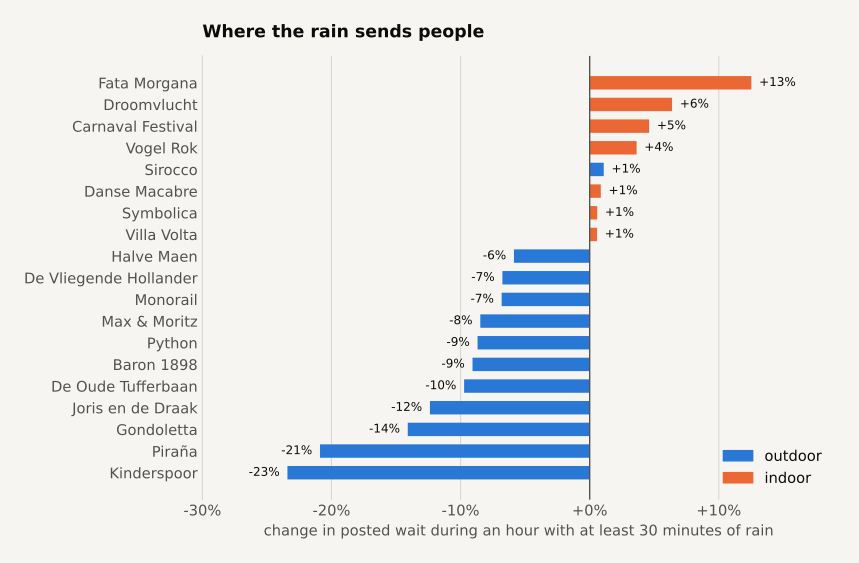
During a wet hour the Piraña loses a fifth of its queue and the outdoor coasters lose about a tenth. Fata Morgana gains 13%. The shift is smaller than I expected, probably because posted waits lag behind reality and because half the crowd simply buys a poncho.
Heat does the opposite to one ride. On summer days above 30 degrees almost every queue shrinks, except the Piraña, which more than doubles compared to a cool summer day.
How to spend the day#
This is the table I would screenshot. It shows the average posted wait per hour on days that are busier than average.
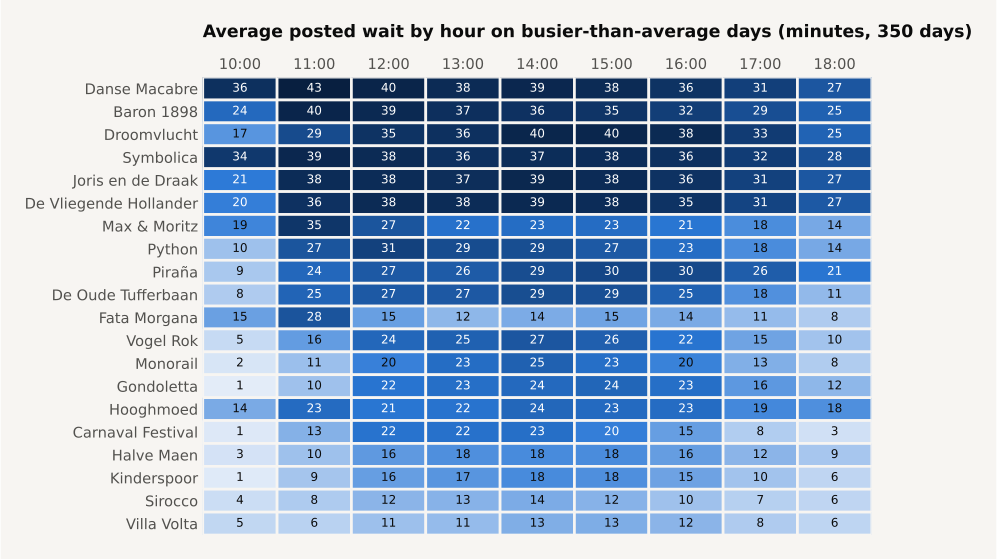
Go to the back of the park first. In the first half hour after opening, Baron 1898, Joris en de Draak and De Vliegende Hollander average 10 to 11 minutes. By midday they are at 37 or 38. Python goes from 5 to 30.
Do not start with Symbolica or Danse Macabre. Symbolica is right behind the entrance and already posts 30 minutes in the first half hour. Danse Macabre does the same. They never get much worse than that, so there is nothing to win by going early.
Max & Moritz and Fata Morgana peak before lunch. Both hit their worst hour at 11:00, when the first wave arrives, and then drop. Max & Moritz goes from 35 to about 22, Fata Morgana from 28 to about 13. If everyone has the same clever plan, it stops being clever.
The family rides peak late. Droomvlucht, Vogel Rok, Carnaval Festival and the Gondoletta are at their worst between 14:00 and 16:00.
Stay until closing. In the last hour most queues are down to about 60% of their midday level. On summer evenings, when the park is open until 22:00, it gets silly: after 21:00 Python averages 8 minutes instead of 23, and Droomvlucht 16 instead of 36.
Ride alone#
Since July 2025 a second collector of mine also stores the single-rider queue for the six rides that report one.
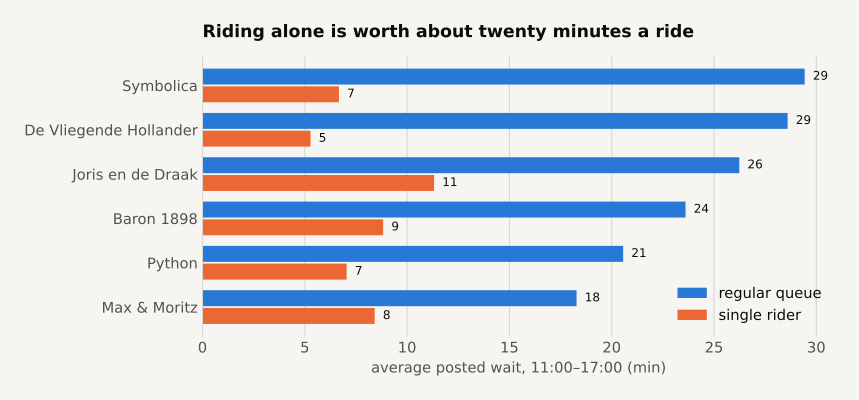
At Symbolica the single-rider line was shorter than the regular one in 99.9% of the readings I have. At De Vliegende Hollander it averaged 5 minutes against 29. You will sit next to a stranger for three minutes. You will survive.
Don't save the unreliable ones for last#
That same collector stores whether a ride is open, closed or down. Counting only days on which a ride did run:
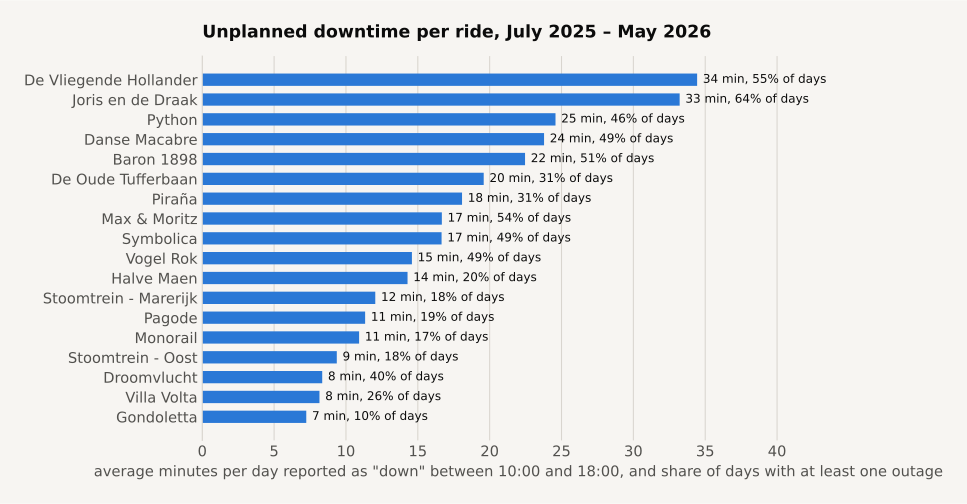
De Vliegende Hollander and Joris en de Draak are down for more than half an hour on an average day, and Joris has at least one outage on 64% of days. If one of those is the reason you came, ride it early. "We'll do it on the way out" is how you end up not doing it.
Stand-outs#
Danse Macabre's opening day. On 31 October 2024 the park opened an hour early and the posted wait hit 260 minutes at 10:00. The daytime average was 133.
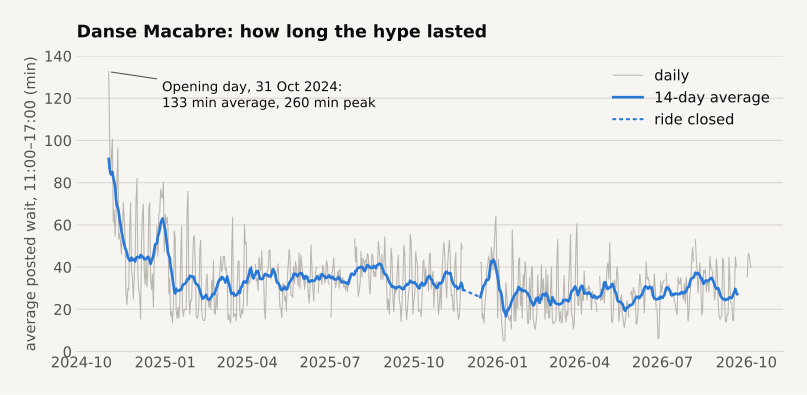
The hype had a short half-life. The first week averaged 91 minutes, the rest of November and December about 50, and by February it was 28. That is three months from four hours to a normal headliner. Since then it has moved between 25 and 40 with the seasons. One caveat for the later part: since 22 April 2025 the ride also has a virtual queue, which my data does not see, and the park itself says the regular queue gets a bit longer when it is on.
Hooghmoed. The new drop towers opened on 1 May 2026 and posted 80 minutes ten minutes after the gates opened. Two days later a single reading says 230. That was the day two of the three towers were out and capacity dropped from 600 to 200 people per hour. By September the daytime average was 14 minutes.
It got busier, and then it stopped. From September 2023 to August 2024 the average day came out at 17.0 minutes. The year after that it was 19.0, and the most recent one 18.4. So queues are about a tenth longer than when I started, but they have not grown in the last year. That fits the park's own situation: visits went from 5.56 million in 2023 to 5.78 million in 2025, which is right up against the 5 million unique visitors its permit allows.
The short version#
If you remember nothing else:
- Pick a Tuesday or Thursday outside school holidays. It halves your waiting compared to a Saturday.
- Off-season weekends are not off-season. A January Sunday queues like an August day.
- Check the Flemish school calendar and the Belgian public holidays, not just the Dutch ones.
- Skip the Wednesday before Ascension and the week after Christmas.
- Let the forecast scare other people. Rain and 30 degrees both empty the park.
- Coasters at opening, family rides before lunch or after five, and stay until close.
- Use the single-rider queues.
What this data can't tell you#
A few honest limits.
Posted waits are the park's own estimates. I have no way to check them against a stopwatch, and I can't see the virtual queues at Danse Macabre and Droomvlucht at all.
About three in ten days are filled in from an external source. Those are whole-day averages that I converted to my 11:00 to 17:00 measure, so they are slightly less precise than my own days. None of the hour-by-hour findings depend on them.
The model explains about 60% of the difference between days. The rest is school trips, events, broken rides and things I don't know about. The weather station is 15 kilometres away, and the English and American holiday dates are typical ones, because neither country has a national calendar.
The collector is still running. I will check back in three years.